What is the probability of rolling Yahtzee?
Observed versus theoretical probability of rolling Yahtzee.
Yahtzee involves chance and strategy. Part of the strategy portion is understanding your chances of hitting different combinations of dice. Getting a “YAHTZEE” involves rolling 5 dice of all the same number in 3 rolls or less, and amounts to 50 points. During the course of the game, you can choose to aim for YAHTZEE or any other combination which earns you points, like Fives or Full House.
For the sake of simplicity, I’m going to assume that all you care about is hitting YAHTZEE. The way it works is:
- you have 3 rolls to hit Yahtzee,
- you can choose which dice to re-roll between rolls,
- and you have to get 5 dice of the same number.
Given these rules, if you want to hit YAHTZEE, the best strategy is to:
- roll the first time,
- avoid re-rolling whatever number comes up most frequently in the prior roll,
- and continuing re-rolling until you get YAHTZEE.
According to this article by someone who crunched the numbers, using the best strategy, you have a 4.74% chance of hitting YAHTZEE in 3 rolls or less. But theoretical probability is not what necessarily happens when you go to roll the dice. Then again, even in practice, with enough rolls, we would expect the chance that you hit YAHTZEE in 3 rolls or less to be really close to 4.74%. I’m going to test that.
Instead of rolling the dice 10,000 times by hand, the code below is going to do it for me and record the outcomes. Then we can answer a few interesting questions:
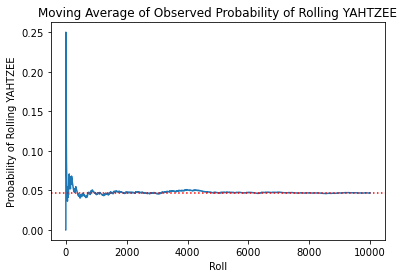
- Did we hit YAHTZEE in 3 rolls or less about 4.74% of the time, as predicted?
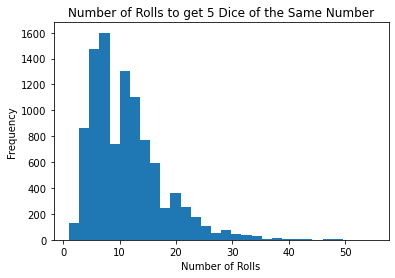
- How many rolls does it normally take to get 5 dice of the same number?
- What does the distribution of the number of rolls it takes to get 5 dice of the same number look like?
Functions
import pandas as pd
import numpy as np
import random
import statistics
import matplotlib.pyplot as plt
# what a dice roll looks like
dice = [random.randrange(1,7),
random.randrange(1,7),
random.randrange(1,7),
random.randrange(1,7),
random.randrange(1,7)]# get the most frequent number (i.e., the mode) and how often it occurs (i.e., frequency)
def most_freq(dice):
# most common number
mode = statistics.mode(dice)
# how often most common number shows up
freq = dice.count(mode)
return({'mode':mode, 'freq':freq})# when you roll a [6,6,3,5,1], you want to keep the 6's and drop the rest
# in that example, you keep [6,6], which is what this function would return
def remove_non_mode(dice):
# record mode and freq info
mode = most_freq(dice)['mode']
freq = most_freq(dice)['freq']
# return only elements which are the mode
dice_only_mode = [mode for element in list(range(freq))]
return(dice_only_mode)# continuing the prior example, after keeping only [6,6],
# you have to re-roll the other 3 dice
# this function returns [6, 6, random, random, random]
def missing_rolls(dice):
# number of rolls missing
count_missing_rolls = 5 - len(dice)
# list for missing rolls
missing_rolls = []
# create missing_rolls
for missing_roll in list(range(count_missing_rolls)):
missing_rolls.append(random.randrange(1,7))
return(dice + missing_rolls)# you want to keep re-rolling until you get 5 dice with the same number
# this outputs how many rolls it took to get 5 dice of the same number
# and what number was the most common (e.g., [6,6,6,6,6] would be 6)
def roll_until_yahtzee(dice):
# first roll done on dice reset
roll_count = 1
# roll until all 5 dies have the same number
# which means the set would only be one element in length
while len(set(dice)) != 1:
dice = remove_non_mode(dice)
dice = missing_rolls(dice)
roll_count += 1
return({'roll_count':roll_count, 'dice_outcome':most_freq(dice)['mode']})Example of Functions
dice = [6,6,3,5,1]most_freq(dice){'mode': 6, 'freq': 2}remove_non_mode(dice)[6, 6]missing_rolls(remove_non_mode(dice))[6, 6, 1, 3, 6]roll_until_yahtzee(dice){'roll_count': 23, 'dice_outcome': 6}Create Data
# empty dataframe to record data in
roll_data = pd.DataFrame(columns = ['roll_count', 'dice_outcome'])

# number of data points for dataframe
number_data_points = 10000

# run and record data
for roll in list(range(number_data_points)):

    # reset dice
    dice = [random.randrange(1,7),
            random.randrange(1,7),
            random.randrange(1,7),
            random.randrange(1,7),
            random.randrange(1,7)]

    # roll until yahtzee and append info to dataframe
    roll_data = roll_data.append(roll_until_yahtzee(dice), ignore_index=True)
Outcome
# the number of rolls it takes to get 5 dice of the same number
roll_data['roll_count'].hist(bins=30, grid=False)
plt.xlabel('Number of Rolls')
plt.ylabel('Frequency')
plt.title('Number of Rolls to get 5 Dice of the Same Number')
roll_data['roll_count'].agg(['mean','median','std','max','min'])mean 11.134200
median 10.000000
std 6.367279
max 55.000000
min 1.000000
Name: roll_count, dtype: float64# probability of rolling yahtzee in 3 rolls or less
# expect it to be close to 4.74%
prob_yahtzee = len(roll_data[roll_data['roll_count'] <= 3]) / len(roll_data['roll_count'])
prob_yahtzee0.0468# moving average of observed probability of rolling yahtzee
roll_data['ma_prob_yahtzee'] = np.nan
row = 1
while row < len(roll_data):
ma_prob_yahtzee = len(roll_data.loc[1:row].loc[roll_data['roll_count'] <= 3]) / row
roll_data.loc[row, 'ma_prob_yahtzee'] = ma_prob_yahtzee
row += 1ax = roll_data['ma_prob_yahtzee'].plot()
ax.axhline(prob_yahtzee, c='r', linestyle='dotted')
plt.title('Moving Average of Observed Probability of Rolling YAHTZEE')
plt.xlabel('Roll')
plt.ylabel('Probability of Rolling YAHTZEE')
# on average, how many times you would have to play
# to hit yahtzee in 3 rolls or less
round(1 / prob_yahtzee, 2)21.37# checking if outcomes have a uniform distribution
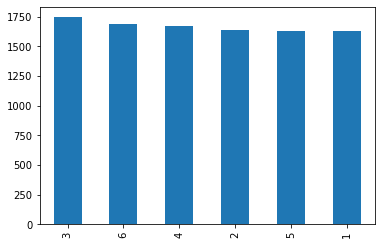
roll_data['dice_outcome'].value_counts().plot(kind='bar')
Answering our questions
Did we hit YAHTZEE in 3 rolls or less about 4.74% of the time, as predicted?
Although not exact, the observed probability was really close at 4.68%. You can see that the observed probability became closer to the theoretical probability as we took more rolls.
How many rolls does it normally take to get 5 dice of the same number?
About 11 rolls
What does the distribution of the number of rolls it takes to get 5 dice of the same number look like?
It has a mean of about 11.1, a standard deviation of about 6.3, and a right skew.